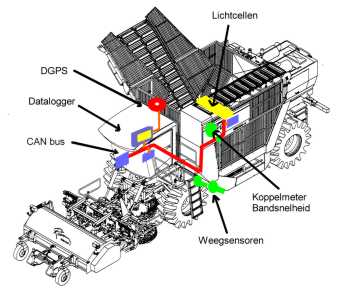
The CAN bus (depicted in Red) connects four modules (purple) with the following functions:
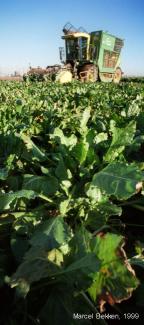
The objective of this project is to determine in field variability of sugarbeet yield and quality.
In 1997, manual crop samples were taken and a start was made with the development of yield sensors for a sugarbeet harvestor. The manual samples were taken close to crop and soil monitoring points. The yield sensors were based on a mass flow measurement and a volumetric flow measurement of sugarbeets entering the collector bin.
Preliminary results showed both sensor systems produce a similar yield pattern. So, the project extended
into 1999 and now consists of the following work items:
A scheme of the yield mapping system mounted on the sugarbeet harvestor.
The CAN bus (depicted in Red) connects four modules (purple) with the following functions:
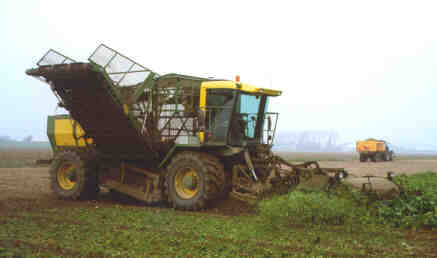
The sugarbeet harvestor busy in a field in 1997. The data logger was initially mounted
in the grey box above the right front wheel. Since 1999, the CAN based system is
distributed over the machine and the data logger fits well in the operator's cab.
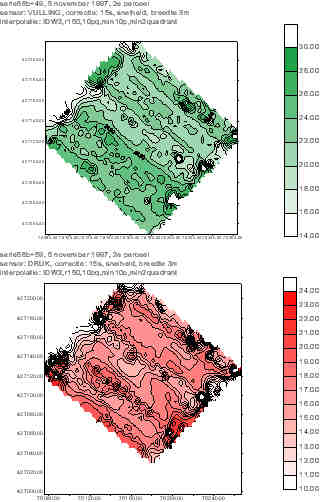
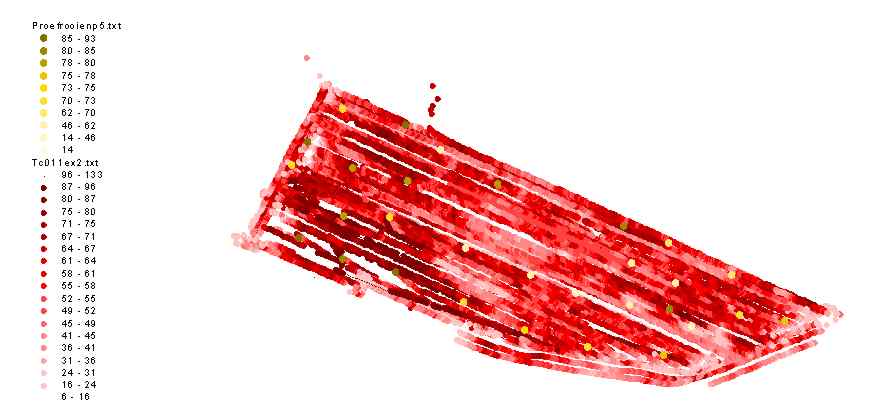
A more detailed experiment in 1999 is shown in this yield map. The manually harvested
samples on a number of locations in the field are quite similar to the raw yield points
determined by the mass flow measurement system based on belt drive torque. The scales
are expressed in ton/ha gross mass.
 go to main index of this site ...